
| 일 | 월 | 화 | 수 | 목 | 금 | 토 |
|---|---|---|---|---|---|---|
| 1 | ||||||
| 2 | 3 | 4 | 5 | 6 | 7 | 8 |
| 9 | 10 | 11 | 12 | 13 | 14 | 15 |
| 16 | 17 | 18 | 19 | 20 | 21 | 22 |
| 23 | 24 | 25 | 26 | 27 | 28 | 29 |
| 30 | 31 |
- Dytran
- acoustic control
- wire strain gages
- 모달 시험
- Calibration
- notch control
- weldable strain gages
- 노칭(notching)
- 소리의 크기
- high temperature strain gages
- Sound
- 임펄스 햄머
- noise
- sound level meter
- acoustic calibrator
- stp series
- 소리
- spektra
- 소음 측정
- 인공위성시험
- 소음계
- 암소음
- 고온용 스트레인 게이지
- wtn series
- 소리의 합
- stn series
- aps dynamics
- flvt
- 900도
- 5850b
싸이러스(Cylos)
What are FRFs? ; Frequency Response Function, FRF 소개? 본문
What are FRFs? ; Frequency Response Function, FRF 소개?
cylos 2024. 11. 11. 09:00목차
1. What are FRFs? (FRF란 무엇인가?)
2. Calculating FRFs (FRF 계산)
3. Computing the Coherence (Coherence(일관성) 계산)
위 그림을 클릭하시면 싸이러스 홈페이지로 이동합니다.
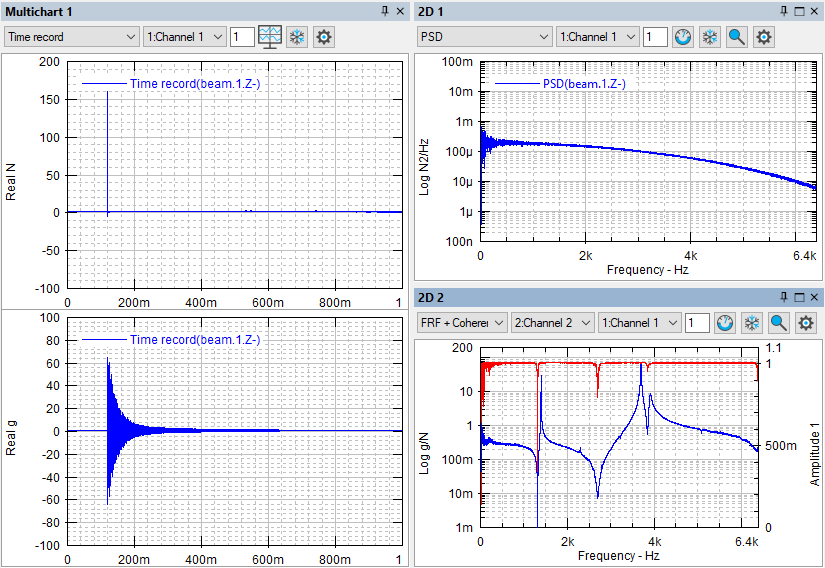
1. What are FRFs? (FRF란 무엇인가?)
The FRFs are a function of the characteristics of the system and are independent of the input type. We assume linearity, time invariance, observability, and reciprocity when we calculate FRFs. The FRF magnitudes have peaks at the system resonances and dips at the system anti- resonances. The FRF phase drops 180 degrees through a resonance and rises 180 degrees through an anti-resonance.
FRF는 시스템 특성의 함수이며 입력 유형과 무관합니다. FRF를 계산할 때 선형성, 시간 불변성, 관측 가능성 및 상호성을 가정합니다. FRF 크기는 시스템 공진에서 피크를 가지며 시스템 반공진에서 딥을 갖습니다. FRF 위상은 공진을 통해 180도 떨어지고 반공진을 통해 180도 상승합니다.

A driving point measurement is a measurement where the input degree of freedom (DOF) is the same as the output DOF. The imaginary part of a driving point FRF should be completely positive or completely negative, depending on the positive or negative orientation of the input and output signals. The peaks or dips of the imaginary part of a driving point FRF correspond to the system resonances.
구동점(Driving point) 측정은 입력 자유도(DOF)가 출력 DOF와 동일한 측정입니다. 구동점(Driving point) FRF의 허수 부분은 입력 및 출력 신호의 양극 또는 음극 방향에 따라 완전히 양수이거나 완전히 음수여야 합니다. 구동점 (Driving Point) FRF의 허수부의 피크 또는 딥은 시스템 공진에 해당합니다.

2. Calculating FRFs (FRF 계산)
mp Analyzer provides H1, H2 and Hv frequency response function estimators, which can be selected in the Save window.
mp Analyzer는 Save window에서 선택할 수 있는 H1, H2 및 Hv FRF (Frequency Response Function) 기능을 제공합니다.
The estimators have the following characteristics.
이 기능은 다음과 같은 특징을 가지고 있습니다.
◎ The H1 estimator provides good results in the field of anti-resonances.
It is equal to the cross-spectrum, between the response and force, divided by the auto- spectrum of the force.
◎ H1 함수는 반공진 공간에서 좋은 결과를 제공합니다.
이는 응답과 힘 사이의 교차 스펙트럼을 힘의 자동 스펙트럼으로 나눈 것과 같습니다.

An important point about H1 is that random noise on the output is removed during the averaging process of the cross-spectrum. As the number of averages is increased, H1 converges to the true H.
H1에 대한 중요한 점은 교차 스펙트럼의 평균화 과정에서 출력의 random 노이즈가 제거된다는 것입니다. 평균의 수가 증가함에 따라 H1은 실제 H에 수렴됩니다.
◎ The H2 estimator provides good results in the field of resonances.
◎ H2 함수는 공진 공간에서 좋은 결과를 제공합니다.

By using H2, the input noise is removed from the cross-spectrum during the averaging process. As the number of averages is increased, H2 converges to the true H.
H2를 사용하여 평균화 프로세스 동안 교차 스펙트럼에서 입력 노이즈가 제거됩니다. 평균의 수가 증가함에 따라 H2는 실제 H에 수렴됩니다.
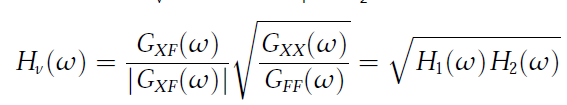
◎ The Hv estimator gives the geometric mean of the H1 and H2 estimators and provides good results in the case of noisy input and output signals. To calculate the Hv estimator both H1 and H2 estimator are used.
◎ Hv 함수는 H1 및 H2 함수의 기하 평균을 제공하며 잡음이 있는 입력 및 출력 신호의 경우 좋은 결과를 제공합니다. Hv 함수를 계산하기 위해 H1 및 H2 함수가 모두 사용됩니다
참조 정보(Reference)는 m+p Analyzer 매뉴얼 "참조 목록"를 참조하십시오
3. Computing the Coherence (Coherence(일관성) 계산)
The coherence is an averaged function of the crosspowers and the autopowers. The coherence tells us how linearly dependent the output is on the input. Any noise source that results in a response not linearly related to the input causes incoherence.
Coherence(일관성)은 crosspowers와 autopower의 평균 함수입니다. Coherence(일관성)은 출력이 입력에 얼마나 선형적으로 의존하는지 알려줍니다. 입력과 선형적으로 관련되지 않은 응답을 초래하는 모든 노이즈 소스는 불일치를 유발합니다.
For a deterministic input, such as that used in impact testing, leakage and nonlinearities may be coherent with the input signal. This means we excite them in the same manner for every average. We could have leakage or nonlinearities in the data, and the coherence would not indicate it.
충격 테스트에 사용되는 것과 같은 충격 입력(Impact testing)의 경우 누설 및 비선형성이 입력 신호와 일관성이 있을 수 있습니다. 이것은 우리가 모든 평균에 대해 동일한 방식으로 그들을 가진 시킨다는 것을 의미합니다. 데이터에 누출 또는 비선형성이 있을 수 있으며 일관성이 이를 나타내지 않습니다.
The coherence is a scalar quantity as a function of frequency, with values between 0 and 1. The coherence always reaches the expected value of the function from the upper side. Unless we remove the incoherent noise sources during the averaging process, the coherence will not increase in value with averaging.
Coherence(일관성)은 0과 1 사이의 값을 갖는 주파수 함수로서의 스칼라 양입니다. Coherence(일관성)은 항상 위쪽에서 함수의 예상 값에 도달합니다. 평균화 과정에서 일관성 없는 노이즈 소스를 제거하지 않는 한 평균화와 함께 coherence(일관성) 값이 증가하지 않습니다.

Ideally, the coherence should be 1 across the frequency range of interest. Low coherence values do not necessarily imply poor estimates of the FRFs, but may indicate that we need a higher number of averages to get good estimates of the FRFs.
이상적으로는 관심 주파수 범위에서 coherence(일관성)이 1이어야 합니다. 낮은 coherence(일관성) 값은 반드시 FRF의 잘못된 추정을 의미하지는 않지만 FRF의 좋은 추정을 얻기 위해 더 많은 수의 평균이 필요함을 나타낼 수 있습니다.


FRF 시험장비의 자세한 정보는 sales@cylos.co.kr, 031-251-1905로 문의 또는 싸이러스 홈페이지를 참고하시기 바랍니다.

Reference :
1. mp Analyzer manual
2. 싸이러스 홈페이지 (www.cylos.co.kr)
3. 싸이러스 홈페이지 (http://www.cylos.co.kr/html/2_1_1_10.php)
4. 싸이러스 블로그 (https://blog.naver.com/cylos_co/222505149086)

'기초이론 > 모달분석(Modal Analysis)' 카테고리의 다른 글
| APS 113 Ball-bearing ELECTRO-SEIS® Long-Stroke vibration exciter의 MIMO 가진 시험 (multi input multi output) (1) | 2024.12.05 |
|---|
